Why Route-Level Tracking Matters
Most FedEx ISP owners know their overall revenue and their overall expenses. They can tell you whether last month was profitable. But ask them which specific routes are profitable and which are losing money, and many cannot answer.
This is a problem because aggregate profitability can mask significant variation at the route level. It is entirely possible — and common — for an ISP to have three highly profitable routes subsidizing two money-losing routes. Without route-level tracking, you will never know which routes need attention, which pay rates need adjustment, or which routes to prioritize for optimization.
What to Track Per Route
Revenue Metrics
For each route, track:
- Gross settlement revenue — total payment from FedEx for that route
- Net settlement revenue — gross revenue minus route-specific deductions and chargebacks
- Revenue per stop — net revenue divided by total stops
- Revenue trend — is this route's revenue growing, flat, or declining month over month?
Pull this data from your FedEx settlement reports. Each settlement should break down revenue by route or manifest.
Cost Metrics
For each route, track:
- Driver pay — total compensation for the driver(s) assigned to this route
- Fuel cost — fuel consumed by the vehicle(s) on this route (from fuel card data)
- Vehicle cost — lease payment, insurance, maintenance, and repairs for the route's vehicle
- Workers' comp allocation — proportional share of workers' comp premium based on route payroll
- Other direct costs — scanners, uniforms, equipment specific to the route
Profitability Metrics
From revenue and cost, calculate:
- Gross profit — net revenue minus all direct costs
- Gross margin percentage — gross profit divided by net revenue, expressed as a percentage
- Driver cost percentage — driver pay divided by net revenue
- Cost per stop — total route costs divided by total stops
- Profit per stop — net revenue per stop minus cost per stop
Operational Metrics
To understand why a route is or is not profitable, also track:
- Average daily stops — is the route carrying enough volume?
- Average stops per hour — driver efficiency
- Miles per day — route density indicator
- MPG — fuel efficiency
- Service score — FedEx performance metrics
Setting Up Route Tracking
Step 1: Define Your Routes
Create a master list of your routes with identifiers that match your FedEx settlement data. Each route should have:
- Route ID or name
- CSA assignment
- Assigned vehicle
- Assigned driver(s)
- Pay rate and structure
Step 2: Map Revenue to Routes
Each settlement period, allocate settlement revenue to specific routes. FedEx settlement reports typically provide route-level or manifest-level detail that makes this possible.
Step 3: Map Costs to Routes
This is where most ISPs struggle. Costs need to be allocated to specific routes:
Direct costs (easy to allocate):
- Driver pay — allocated to the route the driver worked
- Fuel — allocated based on fuel card data tied to the route's vehicle
Shared costs (require allocation):
- Insurance — allocate by number of vehicles or payroll
- Workers' comp — allocate by payroll
- Manager salary — allocate evenly across routes or by time spent
- Office overhead — allocate evenly or by revenue proportion
Keep the allocation method consistent from period to period. The exact method matters less than consistency.
Step 4: Calculate and Compare
Each period, calculate profitability metrics for every route and compare them:
| Route | Revenue | Driver Pay | Fuel | Vehicle | Other | Profit | Margin |
|---|---|---|---|---|---|---|---|
| Route A | $5,200 | $2,860 | $680 | $420 | $310 | $930 | 17.9% |
| Route B | $4,800 | $2,880 | $720 | $420 | $310 | $470 | 9.8% |
| Route C | $4,100 | $2,665 | $580 | $420 | $310 | $125 | 3.0% |
| Route D | $5,800 | $3,190 | $740 | $420 | $310 | $1,140 | 19.7% |
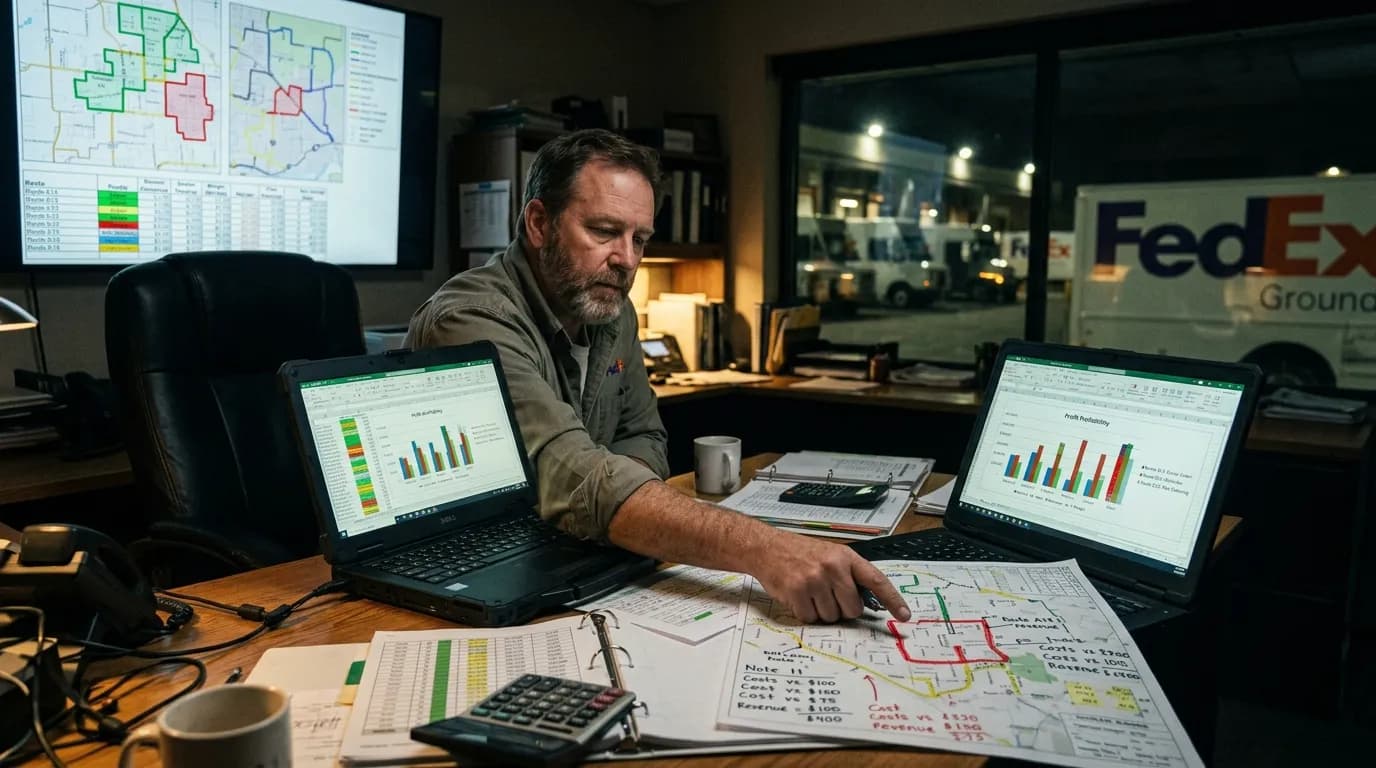
In this example, Route C is barely breaking even while Route D is highly profitable. Without route-level tracking, these routes would be averaged together, hiding the problem.
Using Route Profitability Data
Identify Underperforming Routes
Routes with consistently low margins (below 5%) need investigation:
- Is the driver pay rate too high relative to route revenue?
- Is the fuel cost excessive (inefficient vehicle, long mileage)?
- Are there excessive service failure chargebacks reducing revenue?
- Is the stop volume too low to cover fixed costs?
Optimize Pay Rates
Route profitability data tells you whether your per-stop rates are sustainable. If driver cost consistently exceeds 65% of route revenue, the rate may be too high. If it is below 50%, the rate may be too low (and you may struggle to retain drivers on that route).
Make Informed Expansion Decisions
When considering adding a new route, use profitability data from similar existing routes to model the expected financial outcome. When considering giving up a route, the data shows whether that route is contributing positively to your business.
Negotiate With FedEx
Route-level profitability data strengthens your position in discussions with FedEx about settlement rates, route configurations, and CSA changes. Concrete data about route-level margins is more persuasive than general complaints about profitability.
Plan Capital Investments
If Route D is your most profitable route and its vehicle is aging, you know that investing in a replacement vehicle for that route is a sound use of capital. If Route C is barely breaking even, investing in a new vehicle for that route may not make sense.
Common Mistakes in Route Tracking
Not Tracking at All
The most common mistake. Many ISPs only look at aggregate P&L and miss route-level problems until they become critical.
Inconsistent Cost Allocation
Changing how you allocate shared costs from period to period makes it impossible to compare route performance over time. Pick a method and stick with it.
Ignoring Vehicle Costs
Some ISPs track driver pay and fuel per route but ignore vehicle costs (depreciation, maintenance, insurance). A route with moderate driver costs but an expensive, unreliable vehicle may be less profitable than it appears.
Quarterly Instead of Weekly/Biweekly
Route profitability should be reviewed each pay period, not quarterly. By the time a quarterly review reveals a problem, you have already lost 12 weeks of margin.
Not Acting on the Data
Tracking route profitability is only valuable if you use the data to make decisions. If Route C has been unprofitable for three consecutive months and you have not taken action, the tracking is not serving its purpose.
Automate Route Profitability Tracking
Manual route profitability tracking — pulling settlement data, matching it to payroll, allocating fuel costs, calculating vehicle expenses — is the kind of work that belongs in a purpose-built system.
FleetWage provides route-level profitability tracking as part of its core platform. Settlement data, driver payroll, fuel costs, and vehicle expenses flow into a unified dashboard that shows you route-by-route performance in real time. Schedule a demo to see your route profitability clearly for the first time.