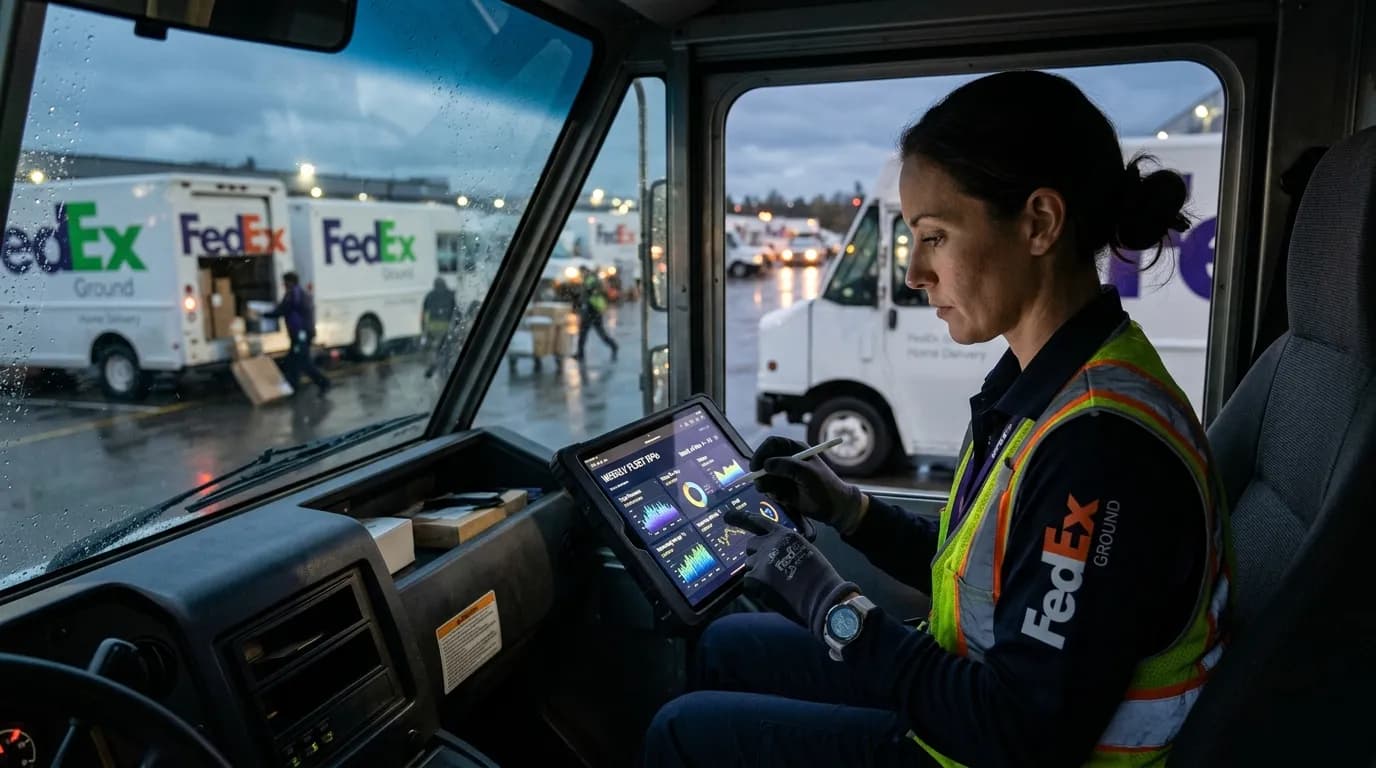
Understanding Your Fleet Dashboard: 5 KPIs Every FedEx Contractor Should Track Weekly
As a FedEx ISP contractor, you're juggling multiple routes, drivers, and operational challenges every single day. But without clear visibility into your fleet's performance, you're essentially flying blind. Your fleet dashboard isn't just a collection of numbers—it's your command center for making data-driven decisions that can make or break your profitability.
While many contractors focus on basic metrics like daily revenue, the most successful fleet operators understand that weekly KPI tracking provides the strategic insight needed to optimize operations and maximize profits. Let's dive into the five essential KPIs that should be at the center of your weekly performance reviews.
1. Total Revenue: Your Fleet's Financial Pulse
Total Revenue represents the complete financial intake from all your routes and drivers over a given period. This isn't just about knowing how much money came in—it's about understanding revenue patterns, identifying growth opportunities, and spotting potential issues before they impact your bottom line.
Why track it weekly: Revenue patterns often fluctuate based on seasonal demands, service area changes, and package volume variations. Weekly tracking helps you identify trends that daily monitoring might miss while still allowing you to respond quickly to significant changes.
What to look for:
- Consistent week-over-week growth or concerning downward trends
- Revenue variations across different routes or service areas
- Correlation between package volume increases and actual revenue growth
- Impact of new routes or service area expansions
Actionable insights: If you notice revenue declining in specific areas, investigate whether it's due to competition, service issues, or changes in customer shipping patterns. Conversely, revenue spikes can indicate opportunities to expand capacity or negotiate better rates with FedEx.
2. Total Stops: The Activity Indicator
Total Stops measures the aggregate number of delivery and pickup stops across your entire fleet. This metric serves as a direct indicator of your operational activity level and helps you understand the relationship between volume and revenue.
Why it matters: Stops are the fundamental unit of work in the delivery business. Tracking total stops helps you optimize route density, plan driver schedules, and identify capacity utilization across your fleet.
Key considerations:
- Stop density per route (more stops in a smaller area = higher efficiency)
- Average stops per driver per day
- Correlation between stop count and fuel costs
- Stop completion rates and service quality metrics
Strategic applications: Use stop data to identify underutilized routes that could handle additional volume or overloaded routes that might benefit from splitting or additional drivers. This metric also helps in capacity planning when considering fleet expansion.
3. Total Profit: The Bottom Line Reality Check
Total Profit is your revenue minus all operational expenses, giving you the clearest picture of your fleet's actual financial performance. This is where many contractors get a reality check about their business's true health.
Beyond simple calculations: Effective profit tracking requires accounting for all expenses including fuel, driver wages, vehicle maintenance, insurance, and administrative costs. Many contractors underestimate hidden costs, leading to inflated profit assumptions.
Weekly profit analysis should include:
- Profit margin trends (profit as a percentage of revenue)
- Cost category breakdowns to identify expense creep
- Comparison of profit per route or per driver
- Impact of fuel price fluctuations on overall profitability
Warning signs: Declining profit margins despite stable revenue often indicate rising operational costs that need immediate attention. Conversely, improving margins might signal operational efficiencies that can be replicated across other routes.
4. Profit Per Stop: Efficiency at Its Core
Profit Per Stop divides your total profit by total stops, revealing how efficiently each delivery contributes to your bottom line. This metric is crucial for understanding the true value of your operational activity.
Why this matters more than revenue per stop: Revenue per stop doesn't account for the costs associated with each delivery. Profit per stop gives you the real economic value of your operations and helps identify which routes or service areas are truly profitable.
Optimization opportunities:
- Routes with high stop counts but low profit per stop may need route optimization
- Comparing profit per stop across different drivers can reveal training opportunities
- Tracking changes in profit per stop over time indicates operational efficiency trends
Benchmarking: Establish baseline profit per stop targets for different route types (residential vs. commercial, urban vs. rural) to set realistic performance expectations and identify improvement opportunities.
5. Driver Performance Metrics: Your Human Asset ROI
While not always displayed as a single KPI, driver performance encompasses multiple metrics including stops per hour, fuel efficiency, and customer service ratings. Your drivers are your most valuable operational asset, and their performance directly impacts all other KPIs.
Key driver metrics to track:
- Average stops completed per hour
- Fuel efficiency by driver (miles per gallon or cost per mile)
- Package handling accuracy and damage rates
- Customer complaint or compliment ratios
- Overtime hours and associated costs
Performance optimization: Use driver performance data to identify top performers who can mentor others, spot training needs, and make informed decisions about route assignments. High-performing drivers often correlate with better profit per stop metrics.
Bringing It All Together: Weekly Dashboard Reviews
The power of these KPIs isn't in tracking them individually—it's in understanding how they interact and influence each other. A weekly dashboard review should examine:
- Trend analysis: Are your KPIs moving in the right direction?
- Correlation insights: How do changes in stops affect profit margins?
- Performance benchmarks: Are you meeting your operational targets?
- Problem identification: Which metrics indicate areas needing attention?
- Growth opportunities: What trends suggest expansion potential?
Best practices for weekly reviews:
- Set aside dedicated time each week for dashboard analysis
- Compare current performance to the same week in previous periods
- Look for patterns across multiple weeks to avoid reacting to anomalies
- Use insights to inform operational decisions for the following week
Making Your Dashboard Work for You
Effective KPI tracking requires the right tools and processes. Manual calculations are time-consuming and prone to errors, while automated dashboard solutions provide real-time insights that enable proactive decision-making.
Your dashboard should provide not just the numbers, but the context and analysis needed to take action. This means having access to historical data, trend analysis, and the ability to drill down into specific routes, drivers, or time periods.
Conclusion
Mastering these five KPIs—Total Revenue, Total Stops, Total Profit, Profit Per Stop, and Driver Performance—transforms your approach from reactive management to strategic optimization. Weekly tracking of these metrics provides the insights needed to make informed decisions that drive profitability and sustainable growth.
Remember, the goal isn't just to track these numbers, but to use them as a foundation for continuous improvement. Every week should bring new insights that help you optimize routes, improve driver performance, and ultimately increase your bottom line.
Ready to take control of your fleet's performance with automated KPI tracking? FleetWage's comprehensive dashboard provides real-time visibility into all these critical metrics and more, helping FedEx contractors optimize their operations and maximize profitability. Stop guessing about your fleet's performance and start making data-driven decisions that drive results.